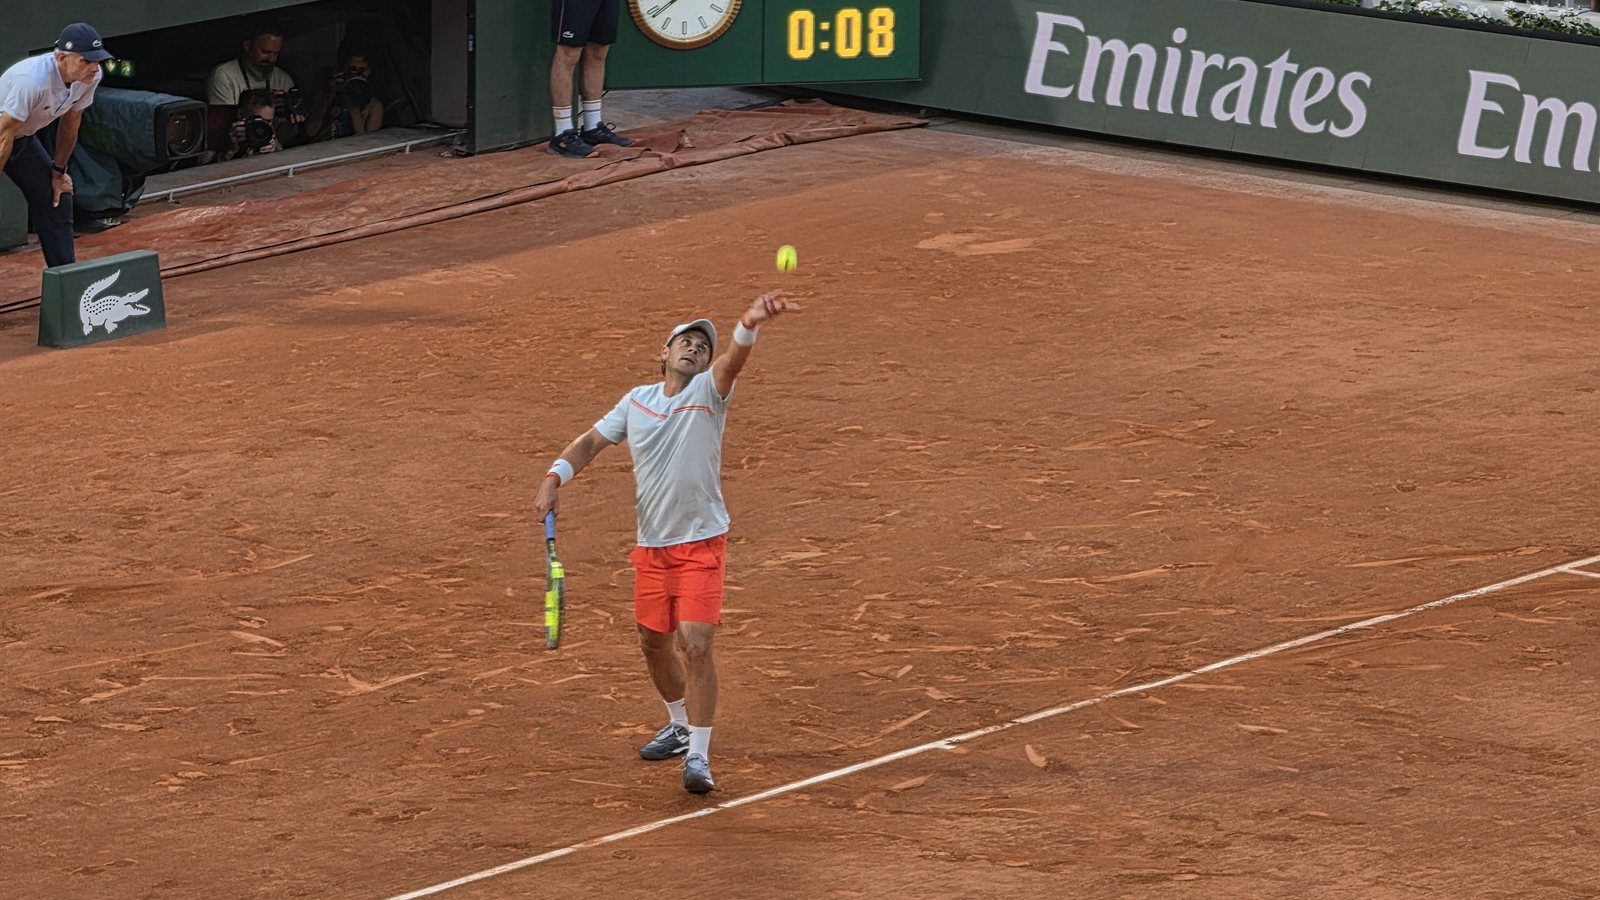

- Measure recent workload: games, minutes, long sets and days of rest for each player, not just the ranking.
- Ask the AI for the table and the math, but you load the data and you verify every figure.
- A small tiredness per point gets amplified across the set and the match: that is why it pays to simulate it.
Save this guide: you will want it open the next time you build your tennis spreadsheet before a tournament.
Your progress is saved in this browser.
What is fatigue in tennis and why does it matter?
Fatigue is the accumulated tiredness that takes a little speed, precision and reaction away from a player.
In tennis you play every day of a tournament.
There are no substitutes and no changes.
If a player arrives tired, he plays anyway.
The ranking says who is better on average.
It does not say how each one arrives at that match.
Two players of the same level can arrive very differently.
One came from two short matches and the other from three extremely long sets.
This article does not promise you a trick.
It shows you how to measure that difference with data and how to see how much it could weigh.
To compare with other sports, read how fatigue is measured in football and the back-to-back in the NBA.
Betting is for adults 18 and over only and there is always a risk of losing.
A fatigue figure adjusts a probability, it does not guarantee a result.
Play only what you can afford to lose.


Which fatigue data is worth measuring in tennis?
There is workload data, travel data and environment data.
Workload data is the most important because it is measured with concrete numbers.
These are the ones I would record for each player.
| Data | What it measures | Where to get it |
|---|---|---|
| Games played | Workload over 3 and 7 days | Match scores |
| Minutes on court | Real wear | Tournament statistics |
| Long sets | Extra effort | Score by set |
| Tie-breaks | Pressure and long points | Score by set |
| Days of rest | Recovery | Tournament schedule |
| Travel and surface | Adaptation | Previous and current tournament |
Games and minutes from the last 3 and 7 days
Add up the games from all the matches in each window.
Use two windows, 3 days and 7 days.
The short one shows immediate tiredness and the long one shows the week’s wear.
If you have the minutes, add those up too: they are more precise than games.
Long sets, tie-breaks and best-of-5 matches
A 6-4 is played faster than a 7-6 with a tie-break.
Count how many sets went past 10 games and how many tie-breaks there were.
In best-of-5 tournaments, a single long match can equal two normal ones.
That is why you should always look at the games, not just how many matches he played.
Travel, change of surface and days of rest
A player who traveled between continents still has his body on another time zone.
One who went from clay to a hard court changed the way he moves and hits.
Write down the previous tournament, the surface and the days between one match and the next.
You do not need to know the exact effect: it is enough to mark who changed and who did not.
Heat, humidity and time of day
The weather changes how tiring a match is.
In heat and humidity the same score wears you down more.
Matches are often played by day and by night in the same tournament.
Write down the time and the temperature forecast, without making up any figure you have not seen.
How to ask the AI to build the fatigue table
The AI does not know how much each player has played this week, unless it has web search with sources.
Even then, it can be wrong.
The rule is simple: you paste the data and the AI organizes and calculates.
That way you keep it from making up results.
Act as a tennis data analyst.
I am giving you the scores of the last 7 days for two players (A and B).
Use ONLY that data, do not add or make up anything.
For each player, build a table with: games played in the last 3 days, games in the last 7 days, number of sets with more than 10 games, number of tie-breaks and days of rest before today’s match.
Show each sum step by step.
If a figure is missing, write “no data”.
At the end, summarize in two lines the workload difference between A and B, without recommending any bet.
If your AI has web search, ask it to cite the source of each score and open it.
If it cannot show you the source, do not use the figure.
For more on which AI to choose, see the comparison of AIs for betting.

How tiredness becomes a probability
You already have the table.
Now comes the uncomfortable question: how much is that tiredness worth?
Nobody has the exact figure.
What we can do is test scenarios and see what happens.
The idea is to start from the point.
In tennis everything is built from points: a game is points, a set is games and a match is sets.
If you change the chance of winning a point just a little, everything else changes.
The simple model: independent points
We assume each point is independent of the previous ones.
It is a simplification: in reality there are streaks and pressure.
But it works to see the order of magnitude.
We define two example numbers: how much A wins when serving and how much B wins when serving.
| Case (example) | A wins on serve | B wins on serve |
|---|---|---|
| No fatigue | 64% | 62% |
| A loses 1 point | 63% | 63% |
| A loses 2 points | 62% | 64% |
| A loses 3 points | 61% | 65% |
“Loses 1 point” means A wins 1 percentage point less when serving and 1 percentage point less when returning.
That is why B’s column goes up by as much as A’s goes down.
All these numbers are an example, not data from any real player.
From points to the set and the match
With those numbers you calculate the chance of winning a game, then a set with its tie-break and finally the match.
The calculations are done with code, not by hand.
I solved them with a program that runs through every possible combination of points.
It is not a random draw: it is an exact calculation of this simplified model.
| Case (example) | A’s points | A’s set | Best-of-3 match |
|---|---|---|---|
| No fatigue | 51.0% | 56.7% | 59.9% |
| A loses 1 point | 50.0% | 50.0% | 50.0% |
| A loses 2 points | 49.0% | 43.3% | 40.1% |
| A loses 3 points | 48.0% | 36.9% | 30.7% |
Look at what happens.
A wins barely 1 percentage point fewer of the points and the chance of winning the match falls from 59.9% to 50.0%.
With 3 points less, it falls to 30.7%.
A small change per point gets amplified because you have to win many points in a row.
| Case (example) | A in 3 sets | A in 5 sets |
|---|---|---|
| No fatigue | 59.9% | 62.4% |
| A loses 1 point | 50.0% | 50.0% |
| A loses 2 points | 40.1% | 37.7% |
| A loses 3 points | 30.7% | 26.5% |
Best-of-5 matches amplify the difference more.
The better player has more chances to impose himself.
But the tired one also has more sets in which to wear down, something this model does not measure.
That is why it is only an example to think with.
What this simulation does NOT say: it does not say how much fatigue affects any real player.
The 64%, 62% and the deductions are example numbers.
The calculation is true for those numbers, reality may be different.
How to simulate fatigue with your own data
You can do the same with your numbers.
First you have to define how much each player wins on serve under normal conditions.
That figure comes from his season average, which is in the tournament’s official statistics.
Second, you pick a fatigue deduction and test several.
Write me a Python program, explained line by line, to calculate the probability of winning a tennis match.
Inputs: percentage of points A wins when serving, percentage of points B wins when serving, and a best-of-3 or best-of-5 format.
Assume each point is independent.
Calculate the chance of winning a game, a set (with a 7-point tie-break) and the match.
Include a test: if both win the same on serve, the result must be 50%.
Show me the output for fatigue deductions of 0, 1, 2 and 3 percentage points.
What are the limits of measuring fatigue in tennis?
There are several traps.
The first is the small sample: few matches give unstable averages.
The second is bias: the one who went through long rounds is probably a good player, which is why he got that far.
The third is that some players recover better than others.
- Injuries: a player can be injured and the scores do not show it.
- Motivation: some tournaments matter more to the player than others.
- Opponent: a long match against a tough opponent does not tire you the same as a long one against an easy opponent.
- Market: bookmakers also know this data and already reflect it in the odds.
That is why fatigue works as one more filter.
It is not a sufficient reason to bet.
If the workload difference is small, ignore it.
If it is large, use it to review a bet that had already convinced you for other reasons.
To protect your sample, write down every bet in a spreadsheet.
An Excel template for tracking bets works for that.
And to understand how many bets you need to draw conclusions, read how many bets you need to know whether you are winning.
What Gambeta offers in tennis and where fatigue fits in
Gambeta has a tennis tab with ATP and WTA predictions.
The model uses the ranking difference between the two players.
Since bookmakers do not price many tournaments, it publishes fair odds, which are 1 divided by the probability.
It does not publish picks below odds of 1.50.
Every tennis pick is settled only with the winner reported by ESPN.
If the match is not played, it is voided and the stake is returned.
The current model does not measure fatigue: it is based on the ranking.
The analysis in this article is a layer you build on top yourself.
The record of all picks is open in Gambeta’s public record.
There you can see how each market has done.
And the Betting Journal summarizes each day the picks published and how they turned out.
The full guide is at AI for betting: the complete guide.
Fatigue checklist before analyzing a tennis match
- Write down the games each player has played in the last 3 and 7 days.
- Mark the long sets and the tie-breaks of each one.
- Compare the days of rest since the last match.
- Check whether there was a long trip or a change of surface.
- Check the weather and the time of the match.
- Ask the AI for the table and verify two calculations by hand.
- Try the simulation with deductions of 0, 1, 2 and 3 points.
- If the difference is small or doubtful, do not use it.
What to read next
If you want to build your own analysis assistant, continue with how to create and train your own AI for betting.
If you are interested in how tiredness looks in football, read fatigue and schedule in betting.
And if you want to compare with a sport of back-to-back games, look at the back-to-back in the NBA.
To see which AI suits you, the comparison of AIs.
Remember: 18+ only, and betting is not a way to make money.
If you feel you are losing control, ask for help.
We explain it in betting responsibly.
Frequently asked questions
How do you measure a tennis player’s fatigue?
With the workload of recent days.
Add up the games and minutes played in the last 3 to 7 days, and count the long sets and the tie-breaks.
Add days of rest, travel and change of surface.
How many days of rest are needed?
There is no magic number.
It depends on the player, the surface and how long the previous match lasted.
That is why it pays to compare the workload and rest of both opponents rather than look at a single figure.
Can the AI tell me who arrives more tired?
It can organize and calculate, but only with the data you give it.
If it has no access to recent results, it will fill in with made-up data.
Give it the table yourself and ask it not to add anything.
Do best-of-5 matches tire players more?
Yes, for a simple reason: more games and more minutes are played.
In best-of-5 tournaments, the workload accumulated in the early rounds weighs more in the later rounds.
Always measure it in games and minutes, not by the round.
How much does the probability drop from being tired?
There is no universal figure.
What you can do is test scenarios, for example subtracting one or two percentage points per point played.
In this article you see how the match changes with each scenario.
Does Gambeta use fatigue in its tennis picks?
Not today.
Gambeta’s tennis model is based on the ranking difference and publishes fair odds with a floor of 1.50.
Fatigue is an analysis of your own to complement it, and tennis picks appear when there are matches that meet the rules.